#5: Understanding the indicators of economic recovery
Since March of 2020 (when the first lockdown was announced in India in the wake of COVID), economic recovery has been a sticky subject. Experts are divided on whether the government is doing enough, how disparate the recovery will be for haves and have-nots, how fast or slow should the recovery be expected, and so on.
One important topic that has emerged from these ongoing debates is the ‘indicators’ of economic recovery. Turns out, there are perhaps as many kinds of indicators as there are analysts out there 🤯.
As an investor, it becomes a task to track all these numbers, and even more difficult is to understand what to make of these numbers. So, here I am, describing some of the most used ‘unconventional’ indicators and even giving the latest charts.
Before I list it all out, there is one important discussion. The economy is a broad subject. So is ‘economic recovery’. Yet, it all boils down to one thing - activity. More activity in the economy normally means that money is churning, it is changing hands fast. That means that the economic cycle is moving. A moving economic cycle creates jobs, income, and GDP.
All the indicators listed below should be read in light of this very fact.
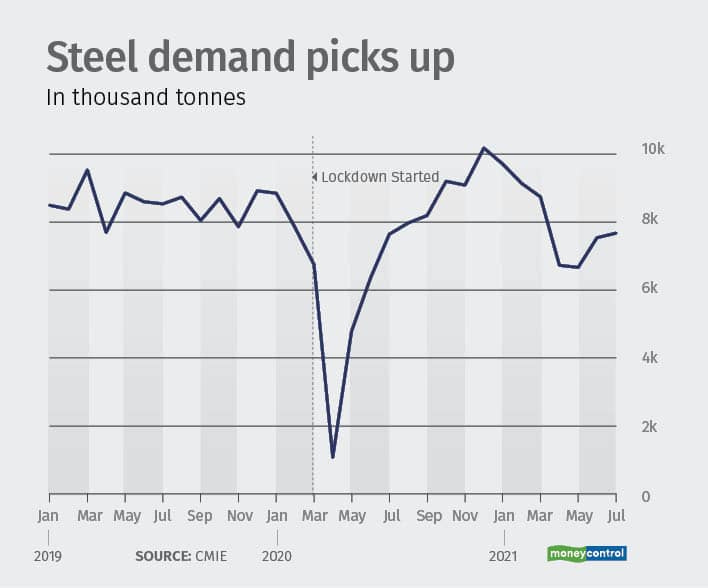
Steel consumption
The growth of the steel sector depends on the growth in real estate, construction, automobile, cement, etc. That basically means that if there’s a growth in steel, it’s backed by robust construction activity and automobile production. That counts towards solid economic recovery. Vice versa is true as well.
Here’s a chart for steel demand over the past two years:
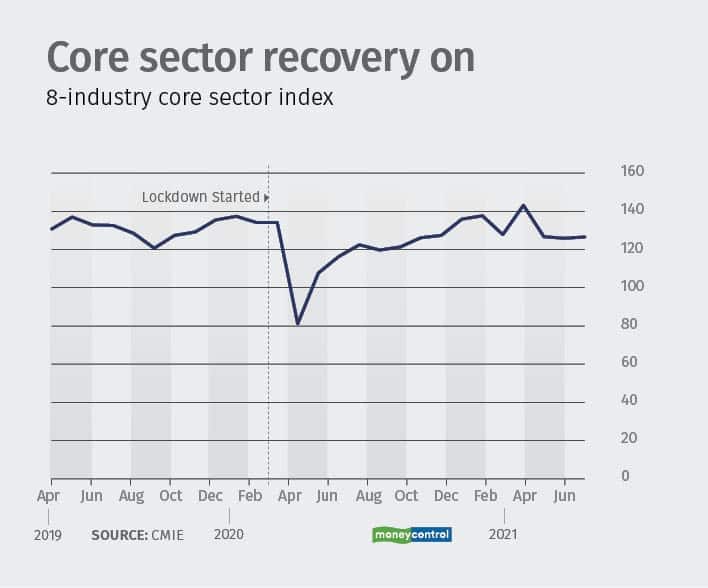
Core Sector
As the name suggests, this index comprises of the ‘core sector’ of the economy - basically the combination of eight important areas that fuel growth. These areas are -
Electricity
Steel
Refinery Products
Crude Oil
Coal
Cement
Natural gas
Fertilizers
If you look carefully at this list, you will find that most of these materials are used in one form or the other by every industry/office/business activity. The core sector index is one of the most important numbers to be looked for by any investor. If you have to remember just one from today’s list, let it be this one.
E-way bills
This is the most recent addition to the list of ‘economic indicators’. E-way bills are basically permits for the transportation of goods. The equation is fairly simple here -
More number of e-way bills = More economic activity.
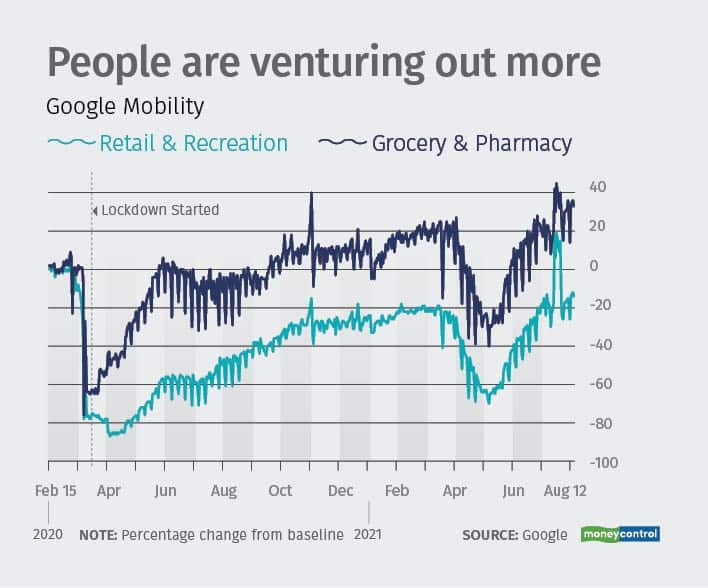
Mobility
This is especially meaningful for the understanding of post-COVID economic sentiment. If people fear going out, they are less likely to spend. Less spending means less economic activity.
This is the reason that mobility data has become more prominent since COVID.
Here’s the mobility trend since Feb 2020 -
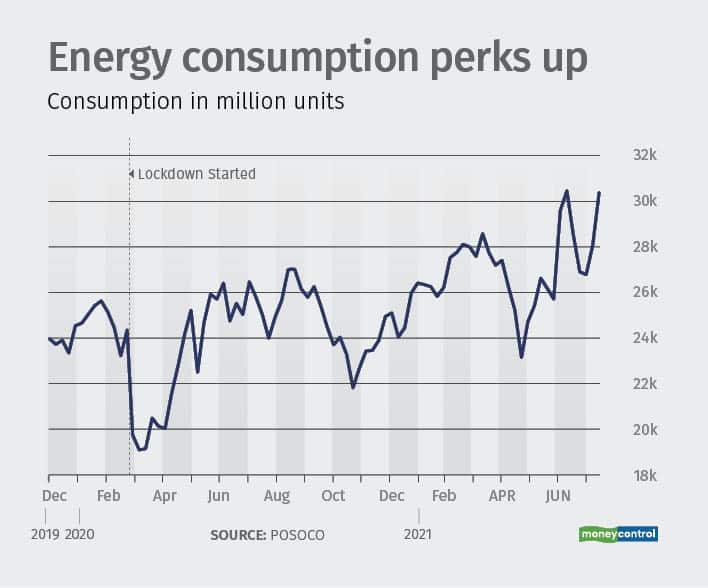
Power and fuel consumption
You get the idea by now. So, straight to the charts -
As might be evident by now, most indicators indicate recovery. We are all hopeful for the same. We know that even if the recovery happens quickly, we all will have lost two good years of progress.
Let’s find respite in the fact that earth got this much-deserved break from the pollution. Going ahead let’s make the progress faster, greener, and more inclusive.
That’s all for today. Tweet your thoughts to us @advthinktank.
You may write your suggestions in reply to this email.
Surbhi Singhal is a Chartered Accountant and a Company Secretary; and the founder of Advance Thinktank. The company specializes in preparing custom research reports regarding investment opportunities in India, tailored to the client's needs.


